1. INTRODUCTION
Las Pailas is a geothermal area located in the south flank of the Rincón de la Vieja active volcano. From 2001 to 2002 the Costa Rican Electricity Institute (ICE) drilled 5 deep wells as a part of the feasibility studies, which demonstrated the existence of a geothermal reservoir with temperatures near 250ºC. Looking the results of the first five wells, ICE is planning to drill 7-9 new production wells and 2-4 for reinjection in order to obtain enough vapour for a 35 MWe power plant. Nowadays, two more wells are being drilled: PGP-08 in the northern sector and PGP-09 to the south, near the caldera border.
The geothermal reservoir is located between 100 and 800 m b.s.l., with temperatures from 205 to 250ºC, with an increasing tendency towards the northern and north-eastern sectors (Chavarría et al., 2006). It is a liquid-dominant-type reservoir; however, there are wells with vapour zones. After flashing at 98°C the fluids have a sodium-chloride composition, neutral pH (7,48-7,85), high TDS contents (12165-13010 ppm), high SiO2 concentrations (607-777 ppm) and low non-condensable gases in steam (0,88% w/w).
The geological studies revealed that most of the reservoir rocks are of explosive origin, characterized by glassy matrix, massive and usually with low permeability. For this reason the distribution and movement of the geothermal fluids seems to be governed by secondary permeability (Chavarría et al., 2006). In this sense the knowledge of the tectonic structures distribution plays a very important role for the location of drill blanks.
In order to improve the understanding of the structural setting of Las Pailas geothermal area, ICE is performing soil gas radon measurements as a complement to other field methods such as water chemical analysis, geological surveys and remote sensors.
Radon (222Rn) is a noble gas produced by the radioactive decay of the uranium chain. In diffusive systems due to its low mobility and its short half-life (3,8 days), radon obviously comes from a short distance below the measuring instrument (Toutain and Baubron, 1999). In areas where slow diffusive flow exists, the average depth of origin is approximately 2 m (Connor et al., 1996). Therefore, the high concentrations of radon are more likely to be due to convective movement of gases rather than diffusive processes. Soil radon activities analyzed in surface conditions depend upon the following main factors: the emanating power of the rock and soil (Morawska and Phillips, 1993), the permeability of the host rock and the flow of the carrying gas (Ball et al., 1991). Generally, radon activities increase with increasing flows, because gas velocity increases, causing both less time for decay and more extraction. Radon is known to be associated with fumarolic gases and hot springs with radon activities usually increasing with water temperature, although its solubility decreases with increasing temperature. It has to be mentioned that radon soil gas activities are also highly perturbed by external factors such atmospheric pressure, temperature and soil humidity variations (Toutain and Baubron, 1999).
The objectives of this study are:
- To study the distribution of the soils gas radon concentrations and define the background values;
- To identify permeable zones by means of radon anomalies;
- To correlate the radon anomalies with tectonic
2. GEOLOGICAL SETTING
The most important tectonic feature of the Central American region is the subduction of the Cocos plate under the Caribbean plate along the Middle American trench convergent margin, with rates of nearly 10 cm/year across the Costa Rican segment of the trench (DeMets et al., 1990). That interaction has generated an internal magmatic arc in which the Guanacaste Volcanic Range comprises its north-western segment (Figure 1).
The location of Las Pailas geothermal area is clearly related to the activity of a Quaternary volcanic system, in particular with Rincón de la Vieja volcano. It is a composite stratovolcano in the north western part of Costa Rica, belongs to the Guanacaste Volcanic Range and forms a northwest trending ridge consisting of several eruptive centres (Kempter et al., 1996; Kempter, 1997).
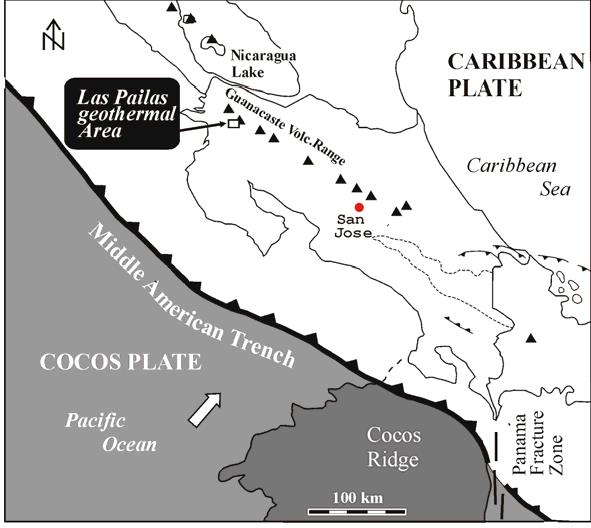
FIGURE 1: Location of Las Pailas geothermal area
Most of the northern sector of the studied area is covered by thick sequences of andesites, basalts and pyroclasts from Rincón de la Vieja volcano. In the central zone, where all the deep wells are located, the lithology consists of andesitic lahars and avalanches originated near the top of the volcano (Figure 2). To the west are extensive conglomerate deposits formed in the first stages of Rincón de la Vieja Volcano. Towards Cañas Dulces caldera border, several dome structures are exposed. They consist of lavas and
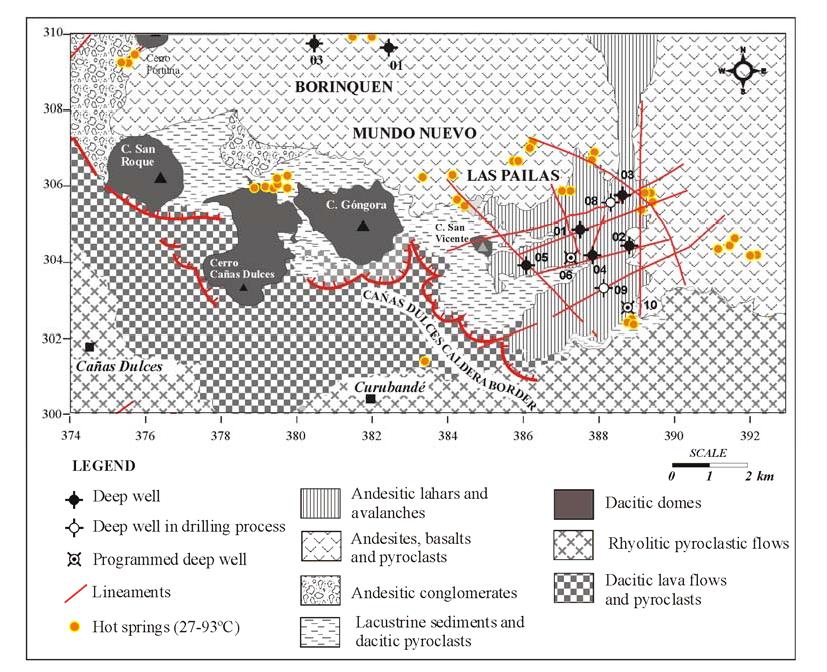
FIGURE 2: Geologic map of Las Pailas (modified from Chavarría et al., 2006)
pyroclastic facies of dacitic composition with a mineralogy represented by plagioclase, hornblende, pyroxenes and magnetite. The southern sector is covered by rhyolitic pyroclastic flows, characterized by the presence of biotite, quartz, hornblende and plagioclase. These flows are widely extended in this region of Costa Rica. The Cañas Dulces caldera border is formed by lava flows and pyroclasts of dacitic composition. These are the oldest lithologies in the area, and are related to the caldera formation (Chavarría et al., 2006).
The tectonic features and structural patterns at Las Pailas are not always clearly evidenced in response to factors like: recent geologic formations, geodynamic of Rincón de la Vieja volcano, weathering and dense vegetation. For that reason, it was necessary to integrate the information generated by field geology, thermal springs,
remote sensors, geophysical surveys and deep wells in order to classify the structural patterns. All those elements were unified in a geographical information system (GIS) and a spatial analysis was carried out applying some methods like union, intersection and combination of queries (Figure 3).
From this analysis it was concluded that in Las Pailas
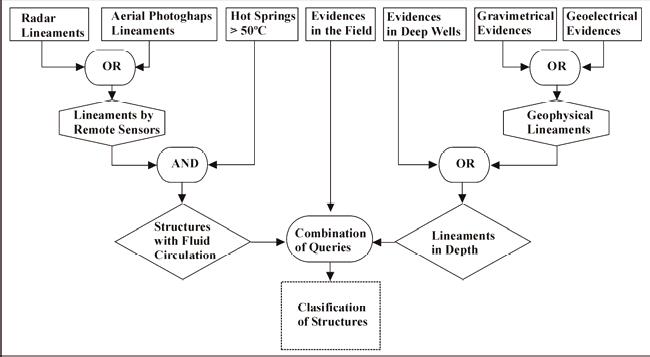
FIGURE 3: Flow diagram of classification of structures
there are at least 9 geological structures distributed in 3 structural systems with NE-SW, NW-SE and N-S trending. It is important to mention that at a regional scale there is a fourth system. The intersection of those structural systems creates a condition that enables permeability and therefore the circulation of geothermal fluids.
1. METHOD OF MEASUREMENT
The radon electronic detector used is a RAD7 from Durridge Company. This equipment uses an air pump and a solid state alpha detector which consists of a semiconductor material (usually silicon) that converts alpha radiation directly to an electrical signal. One important advantage of solid state devices is ruggedness. Another advantage is the ability to immediately distinguish radon from thoron by the energy of the alpha particle emitted. This technique is known as alpha spectrometry. The standard units for measuring the radioactivity in this case are picocuries per litre (pCi/l). One pCi is equal to the decay of about two radioactive atoms per minute. RAD7 was configured to sniff mode, which allows detecting rapidly changes in radon concentration.
The sampling campaign extended from January to May 2008, covered an area of approximately 63 km2 and included 259 sampling points on a 500 x 500 m grid. To measure radon activities in soil gas, a 50 cm depth and 2 cm wide hole was made inserting an iron bar through the soil with the aid of a hammer. Sometimes the depth of the hole was less than 50 cm because soils were poorly developed
above the parent rock or their clastic nature with many boulders did not allow the bar to reach that depth. A probe consisting on an aluminium pipe was inserted into the hole and was connected with a rubber hose to a 250 ml filtration flask in order to avoid any water entrance to the detector. After the flask, the air passed throughout a desiccant tube, then to a filter and finally to the RAD7 (Figure 4). Before the counting process started the hole was clogged with ground or organic matter to avoid soil air to be mixed up with atmospheric air. At least three determinations were made in every sampling point within 5 minute intervals, taking as representative the average value.
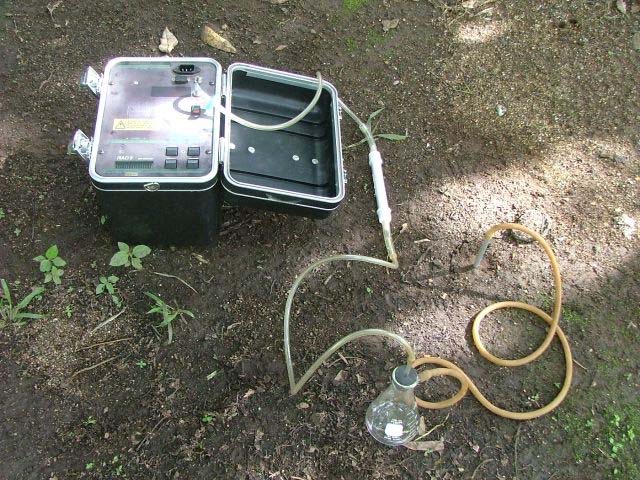
FIGURE 4: RAD 7 equipment and sampling arrange
4. RESULTS
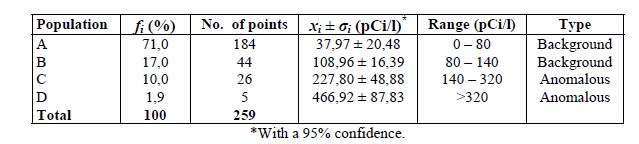
An average value of radon activity in pCi/l was calculated for each sampling point. All the values were grouped in classes of 10 pCi/l intervals and then the cumulative probability was obtained. The selection of the background values and the statistical treatment of data followed the graphical procedure of Sinclair (1974), which is based on a detailed analysis of the distributions in probability plots. The probability graph of the radon activity in Las Pailas geothermal area shows that the data set fits a curve with three inflection points (Figure 5). This indicates that there are at least four populations with distributions A, B, C and D in the proportions of 71%, 17%, 10% and 1.9%, respectively. The estimated frequency (fi), mean (xi) and standard deviation (σi) for each population are reported in Table 1.
The majority of the data set (71%) belong to population A, which correspond to 222Rn activity values below 80 pCi/l. From all the data, 17% correspond to population B with activities from 80 to
140 pCi/l. It is suggested that both A and B populations correspond to background values for the area. Populations C and D with frequencies of 10 and 1.9%, respectively, are anomalous with values higher than 140 pCi/l. D population contents the highest values (>500 pCi/l), although it is small compared to the others, those data were still taken into account because they can provide useful information for future radon campaigns.
Probability (%)
FIGURE 5: Probability plot of 222Rn activity through soil in Las Pailas and surroundings
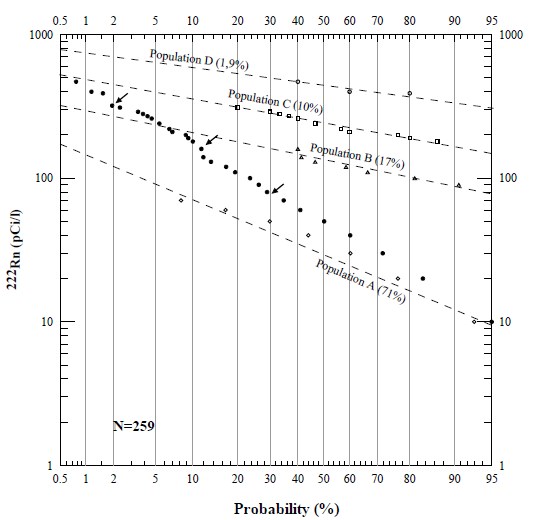
TABLE 1: Estimated parameters of the partitioned populations of radon activities
5. DISCUSSION
Figure 6 is a contour map of radon activity in Las Pailas and surroundings. In this map the anomalies have been differentiated from the background values, allowing a detailed observation of the anomalies distributions and to correlate some of them with the structural lineaments. It is interpreted that the anomalies represent preferential paths for radon movement, from deep levels to the surface; therefore those could be used as an indication of permeable zones. Some of those anomalies can be correlated with structures:
- The N-S trending anomaly near well PGP-02 presents a coincidence with the structure 1 (Figure 6), which extends towards PGP-10 in the southern sector where there is another
- At the centre of Las Pailas a group of anomalies are aligned in a NNW-SSE trend, which could be related to a fracture zone between structures 8, 9, 2 and
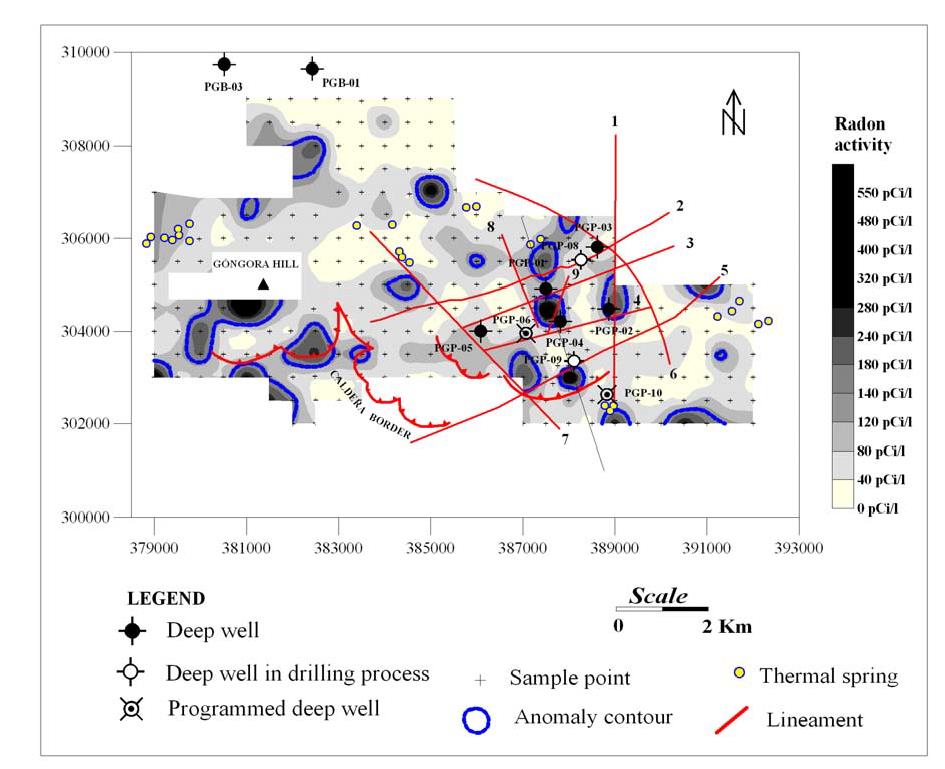
FIGURE 6: 222 Rn activities and main structural features
- There is another anomaly to the south of PGP-09, although there is no apparent structure to link these high radon activity areas, it is possible that structure 8 extends to the
- In the intersection between structures 5 and 7, to the caldera border, there is an anomaly with a NNW-SSE direction. Also, another is present near the intersection of 7 and 2
- In the south-western area, to the caldera border, some radon anomalies suggest permeability in this
- The anomaly located at Góngora dacitic dome could be explained by means of the rock type instead of a tectonic
- Finally, there are isolated anomalies all over the area that cannot be related to any
6. CONCLUSIONS
By means of statistical analysis, the radon background values were defined below 140 pCi/l in Las Pailas geothermal area.
According to the results some of the anomalies are located in the intersection or between structures, suggesting permeable zones associated with those features.
At the centre of Las Pailas there is a group of anomalies with a NNW-SSE direction that could be related to a fractured zone.
Because many external factors can contribute to radon variations it would be important to monitor the fluctuations of this gas in some sampling points distributed over the study area.
REFERENCES
Ball, T.K., Cameron, D.G., Colman, T.B., Roberts, P.D., 1991: Behaviour of radon in the geological environment: a review. Q.J. Eng. Geol.. 24, 169-182.
Chavarría, L., Mora, O., Hakanson, E., Molina, F., Vega, E., Torres, Y., Vallejos, O., Yock, A., Lezama, G., and Castro, S., 2006: Development strategies of the Pailas geothermal field (in Spanish). ICE, 20th Miravalles Consulting Panel meeting report, 79 pp.
Connor, C., Hill, B., LaFemina, P., Navarro, M. , and Conway, C., 1996: Soil 222Rn pulse during the initial phase of June-August 1995 eruption of Cerro Negro, Nicaragua. J. Volcanol. Geotherm. Res., 73, 119-227.
DeMets, C., Gordon, R.G., Argus, D.F., and Stein, S., 1990: Current plate motions. Geophys. J. Int., 101, 425-478.
Kempter, K.A., 1997: Geologic evolution of the Rincón de la Vieja volcano complex, northwestern Costa Rica. University of Texas, PhD thesis, 159 pp.
Kempter, K.A., Benner, S.G., and Williams, S.N., 1996: The Rincón de la Vieja volcano, Guanacaste province, Costa Rica: geology of the southwestern flank and hazards implications. J. Volcanol. & Geotherm. Res., 71, 109-127.
Morawska, L., and Phillips, C.R., 1993: Dependence of the radon emanation coefficient on radium distribution and internal structure of the material. Geochim. Cosmochim. Acta, 57, 1783-1797.
Sinclair, A.J., 1974: Selection of threshold values in geochemical data using probability graphs. J. Geochem. Explor., 3, 129-149.
Toutain, J.P., and Baubron, J.C., 1999: Gas geochemistry and seismotectonics: a review.
Tectonophysics, 304, 1-27.